
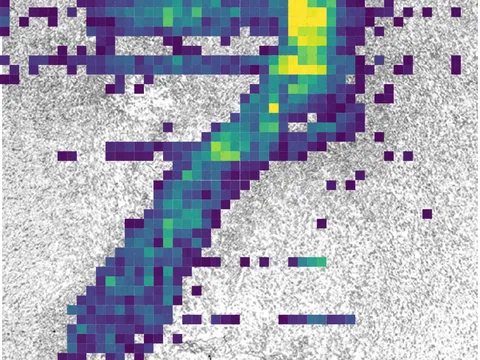
 spatial ATAC-seq
Mouse brain
GSM6753041
mouse brain 16 MB bronze H&E NCBI GEO policy
Technologyspatial ATAC-seq
Organismmouse
Tissuebrain
bronze H&E NCBI GEO policy
We present spatially resolved high-spatial-resolution genome-wide co-mapping of epigenome and transcriptome by simultaneously profiling of chromatin accessibility and gene expression (spatial-ATAC-RNA-seq), as well as histone modification and gene expression (spatial-CUT&Tag-RNA-seq) on the same tissue section at cellular level by combining the microfluidic deterministic barcoding strategy in DBiT-seq and the chemistry used in ATAC-seq/CUT&Tag.
import lamindb as ln
import spatialdata as sd

coll = ln.Collection.get(key="geo-gse218593")
coll.ordered_artifacts.df()                 # the 6 members, ordered

# download every member .zarr to the local cache:
paths = [a.cache() for a in coll.ordered_artifacts.all()]

# …or load each straight into memory as a SpatialData object:
sdatas = {a.key: sd.read_zarr(a.cache()) for a in coll.ordered_artifacts.all()}Emerging spatial technologies, including spatial transcriptomics and spatial epigenomics, are becoming powerful tools for profiling of cellular states in the tissue context<sup>1-5</sup>. However, current methods capture only one layer of omics information at a time, precluding the possibility of examining the mechanistic relationship across the central dogma of molecular biology. Here, we present two technologies for spatially resolved, genome-wide, joint profiling of the epigenome and transcriptome by cosequencing chromatin accessibility and gene expression, or histone modifications (H3K27me3, H3K27ac or H3K4me3) and gene expression on the same tissue section at near-single-cell resolution. These were applied to embryonic and juvenile mouse brain, as well as adult human brain, to map how epigenetic mechanisms control transcriptional phenotype and cell dynamics in tissue. Although highly concordant tissue features were identified by either spatial epigenome or spatial transcriptome we also observed distinct patterns, suggesting their differential roles in defining cell states. Linking epigenome to transcriptome pixel by pixel allows the uncovering of new insights in spatial epigenetic priming, differentiation and gene regulation within the tissue architecture. These technologies are of great interest in life science and biomedical research.
spatial ATAC-seq 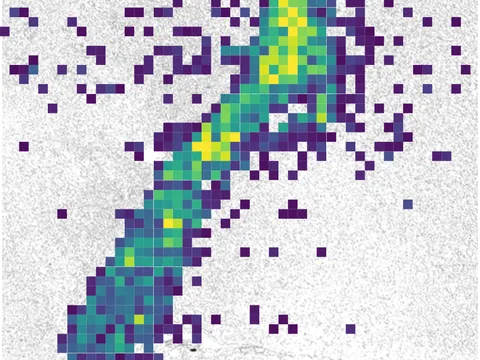 spatial CUT&Tag
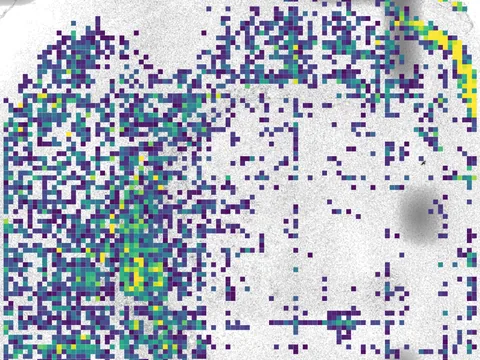 spatial ATAC-seq
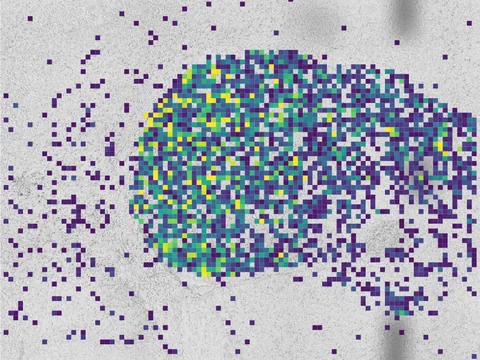 spatial CUT&Tag
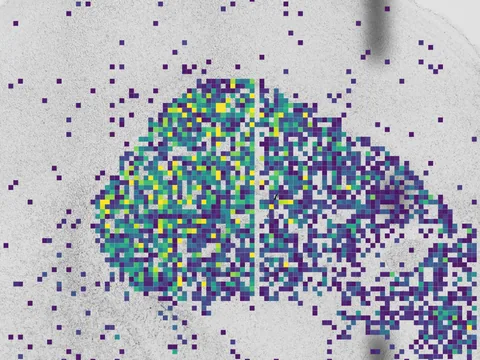 spatial CUT&Tag
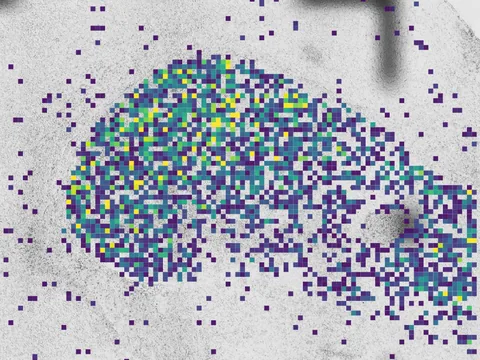 spatial CUT&Tag
No linked publication found — please cite the data source.